A UX metric is an indicator that allows us to objectively determine a digital product's quality, usability, and user satisfaction.
UX metrics help measure user engagement, satisfaction, loyalty, and usability.
These indicators measure, compare, and aggregate results and track trends.
Thanks to this, knowledge about the reactions, behaviors, and needs of mobile applications, web applications, and dedicated software users can be accumulated.
UX metrics are essential in defining and understanding the user experience.
They allow us to analyze and evaluate a website or a mobile application without using subjective, biased criteria, ensuring impartiality and objectivity.
We should remember that whether we have qualitative research results or quantitative data, we need to see the user experience in them.
We need to find objective indicators and measures for it.
We must measure them, express them in a way that allows the results and the data to be compared, and draw binding, practical conclusions from them.
More importantly, using UX metrics helps us communicate UX research results more effectively to stakeholders.
As well as communicate them in a form that is understandable, accessible, attractive, and easy to imagine.
We should also remember that user experience — the user experience of a digital product — consists of the user's emotional, behavioral, and cognitive reactions.
It's necessary to find appropriate UX metrics to measure these three dimensions autonomously and as a single experience to avoid mixing it all up and keep control of the measurement, evaluation, conclusions, and analysis.
So, how should we measure the user experience? What are the most popular UX metrics?
What is the applicability of UX metrics? What can't be measured by UX metrics? What are real user monitoring metrics?
What should UX designers (e.g., performing qualitative research, quantitative research, satisfaction research in an online store) pay attention to?
If you are curious about how to justify usability testing, UX research, and what to pay special attention to when studying user satisfaction, read this article.
UX metrics — what are they?
UX metrics, or UX indicators, are quantitative data that allow us to determine, measure, and compare a website or mobile application user's attitude, reaction, and behavior.
Let's remember that the meaning of this term is suggested by the word indicator itself, which means, according to Merriam-Webster Dictionary, "one that indicates." For example, conversion rate and bounce rate reveal problems with usability.
We can also learn about that from UX research (e.g., using focus groups, in-depth interviews, and qualitative data in general).
Colloquially, indicators help us translate characteristics, phenomena, processes, and their results into more understandable language.
We can express them more precisely, which, of course, is used to introduce changes.
The problem with experience indicators is the elusiveness of some behavioral meanings or the lack of manifestation of responses (such as satisfaction). Therefore, we can use indirect measures that indicate the occurrence of a given phenomenon (e.g., satisfaction, feeling that the product is helpful) to learn about such issues.
Sales are easy to study and express. Human behavior and attitudes require a more creative approach and the discovery of where a particular characteristic manifests itself.
UX metrics can be divided into the following:
- Descriptive metrics, usability metrics that provide information about events.
- Perception metrics that are used to determine attitudes (such as engagement metrics).
Usability metrics help us find out how easy/difficult it is for users to perform a given task.
They allow us to see how much time a particular task requires and how often users make mistakes while performing it.
Descriptive metrics also track typical interaction patterns with a given function of a digital product.
More general UX metrics can be divided into the following:
- Quantitative metrics provide insights into user behavior and interaction methods in a quantitative sense.
- Qualitative metrics give insight into reactions, ways of thinking, opinions, emotions, and attitudes (e.g., satisfaction, loyalty, attractiveness, accessibility, credibility).
- Quantitative metrics often measure the behavioral aspect of interaction with a digital product.
- We can use quantitative metrics to measure, among other things:
- Average time required to complete the task
- Percentage of tasks completed successfully
- Number of views and abandonments
- Percentage of user retention
- User error rate
- Number of active users
- Behavioral attitudes.
In turn, we can use qualitative metrics to measure the following:
- Attractiveness
- Credibility
- Trust that a digital product inspires
- Usability (the ease and intuitiveness of use)
- Emotional and cognitive attitudes
What are real user monitoring metrics?
These are metrics or techniques that allow us to track user activity in real-time. They track things like HTTP requests, crashes, or timeouts. Thanks to them, developers can pinpoint exactly what impacts a website's user experience and what to do to improve it.
Why is user experience research necessary?
The answer seems obvious, but we'll give it. Without using UX metrics, we can't be sure of anything.
Neither in terms of design or optimization nor of development, competitiveness, or strategy for market expansion.
Let's remember that digital products are tools. They're supposed to allow us to achieve goals and perform tasks in a way that is as seamless, fast, intuitive, familiar, and attractive as possible.
UX metrics measure success. They also help us improve and optimize digital products and make them more appropriate to our needs.
In a general sense, UX metrics make it possible to:
- See differences, changes, distances
- Determine ranges, sizes, and intensities.
More specifically, if we change a website or a mobile app, we expect to see a difference in the results it produces.
The result can relate to a wide variety of issues. From an increase/decrease in the average time users spend on a given page through the number of conversions and sense of security to an increase/decrease in the level of trust that a digital product inspires.
UX metrics allow us to capture changes in a narrow scope when we consider a single UX metric and a broad scope when we consider a corpus of UX metrics.
UX metrics change the general impression that something has changed to certainty about what has changed and to what extent. Therefore, UX indicators are used to measure success/failure.
This makes them a strong argument that can be used in conversations between UX designers (e.g., UI developers) and UX researchers and stakeholders representing different goals of an organization (e.g., business).
If we consider the usefulness of marketing metrics, convincing people of the importance of using properly selected UX metrics won't necessarily be difficult.
Later, I'll discuss the similarities and differences between UX metrics and KPIs (Key Performance Indicators).
Why should we use UX metrics?
First, let's start with the fact that UX metrics are a reliable source of insight that can be transformed into useful knowledge.

They're characterized by immediate utility (for use in a specific project and possible future use).
The primary functions of UX metrics provide:
- Evidence of whether something works or doesn't work
- Arguments about how well something works/doesn't work
- Concrete, quantifiable data that allow us to make objective comparisons
- Specifically defined goals and results within a precisely specified time frame
- Material that helps us, through analysis, to observe trends and changes and, therefore, to prepare for them.
Moreover, the use of UX metrics makes it possible to:
- See cause-and-effect relationships by tracking changes — both at the level of the structure of project elements and at the level of the need for continuous optimization of a digital product.
- Diagnose problems, determine their importance, build their hierarchy, and determine the time needed to solve them (e.g., optimize a given function).
- Accurately position a product on the market.
- Make business, design, and technology decisions, both instantaneous and strategic.
What is the difference between UX indicators and KPIs (Key Performance Indicators)?
UX metrics and Key Performance Indicators aren't the same things. We can't use these terms interchangeably. They're measurements used for two different purposes.
UX metrics measure user experience. Key Performance Indicators measure an organization's condition (in general or in a specific dimension).
Key Performance Indicators, for example, allow us to track and compare revenue generated by a single user (RPU — Revenue Per User), Average Order Value (AOV), or the number of subscribers.

They say nothing about the usability of a website or mobile app.
They weren't created to measure user experience; they were designed to measure commercial, marketing, management, and performance results.
Although both use quantitative measures, the data obtained addresses different objectives.
UX metrics are used to discover the level of attractiveness, while KPIs relate more to the level of competitiveness and performance.
With the help of UX metrics, we will learn about how users interact and how attractive a functionality is to them.
We will learn, among other things, about what a source of satisfaction is, what strengthens commitment, and how to increase loyalty.
The most important UX metrics
The use of UX metrics, above all, should be rational and driven by established cognitive, research, design, and strategic goals (UX strategy).
It cannot be art, for art's sake, implemented haphazardly.
UX metrics are the most useful when used:
- In a specific time-frame
- For a particular purpose — to support a solution to a specific problem
- In an intended manner, meaning they are driven by the effect we want to achieve.
Examples of key metrics include the following:
- CES (Customer Effort Score)
- CSAT (Customer Satisfaction Score)
- NPS (Net Promoter Score)
- SEQ (Single Ease Question)
- SUPR-Q (Standardized User Experience Percentile Rank Questionnaire)
- SUS (System Usability Scale)
- TPI (Task Performance Indicator)
- Task Success Rate
- Time spent on task
- User Errors
CES (Customer Effort Score)
The Customer Effort Score is a survey used to measure the level of effort required when a user interacts with an application or website's interface.
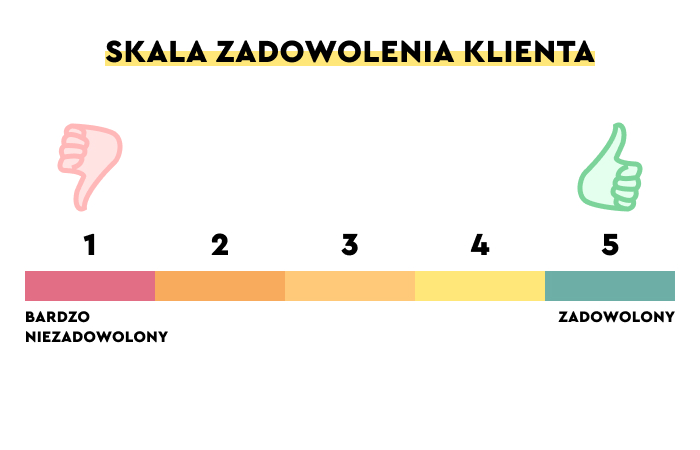
The user is asked to indicate their feelings on a scale.
In practice, several scales are used; among the most popular are:
- Likert scale
- Numerical scale from 1 to 10
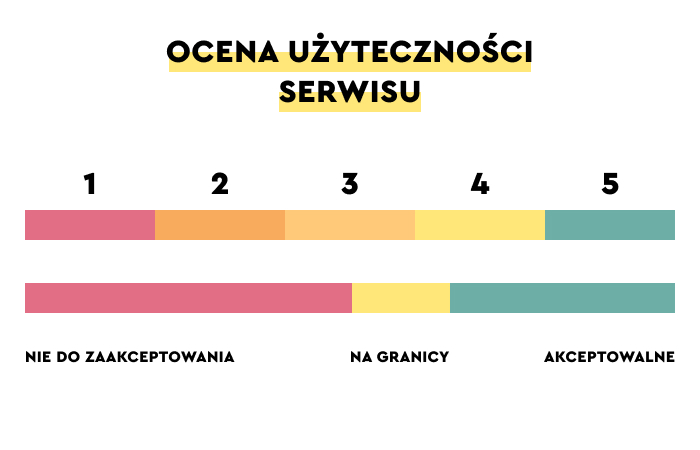
- Rating scale indicating the level of difficulty expressed in words: very difficult, difficult, none, easy, very easy
- Scale with icons in the form of "smiley faces" representing an emotional assessment
CES is a metric addressing Customer Experience that helps understand how easy it is for a customer to interact, achieve a goal, or solve a problem using a product.
CSAT (Customer Satisfaction Score)
The Customer Satisfaction Score is one of the most popular metrics.
It's used to measure the level of satisfaction with using a digital product (or a specific functionality), expressed as a percentage or arithmetic average.
The advantage of CSAT surveys is that they are fast and easy to implement.
NPS (Net Promoter Score)
The Net Promoter Score allows us to estimate satisfaction by indicating how likely a user is to recommend a product to a third party.
Net Promoter Score divides users into three groups:
- Promoters (on a scale they express their desire to promote a site very strongly — 9 or 10 points)
- Passive (7 or 8 points)
- Critics (0 to 6 those who are dissatisfied with the operation of a site)
NPS score represents the difference between the percentage of critics and promoters.
The Net Promoter Score is closely related to user experience — the willingness to make a spontaneous recommendation indicates a positive experience.
SEQ (Single Ease Question)
The Single Ease Question is a survey that allows us (usually on a seven-point scale) to assess the difficulty of performing a given task (such as making a subscription).
SEQ is offered to a user shortly after they complete a task.
The ease/difficulty of performing a single task is strongly related to the time required to complete it.
Users tend to rate tasks as more difficult if they take longer to complete.
SUPR-Q (Standardized User Experience Percentile Rank Questionnaire)
SUPR-Q was created to assess usability, credibility, and user loyalty.
The SUPR-Q questionnaire contains eight questions that address the four most crucial areas from a user experience perspective:
- Usability
- Trust and credibility
- Loyalty
- Attractiveness (of an appearance/aesthetics)
A user provides answers on a Likert scale:
- Strongly disagree
- Disagree
- Neutral
- Agree
- Strongly agree
SUS (System Usability Scale)
SUS is primarily used to measure the usability of digital products and is most often utilized during usability testing.
The System Usability Scale consists of ten questions about usability, the difficulty of use, and learning how the system works.
Respondents answer questions similar to the SUPR-Q questionnaire by using a Likert scale.
TPI (Task Performance Indicator)
The Task Performance Indicator tests crucial tasks a user can perform on a website or mobile app.
Respondents are asked to answer ten questions, which are provided after each task is completed.
The distinguishing feature of this metric is that the survey is repeated after 6 to 12 months to compare results and asks for a determination of the level of confidence in the answer the user gives.
Task Success Rate
The Task Success Rate is an indicator that provides a percentage of the number of tasks a user has completed correctly.
The ability to complete a task correctly and in a satisfactory amount of time affects the user experience rating.
It determines the percentage of users who could complete a task, indicating the intensity of the problem with usability.
The most common tasks that respondents are asked to perform:
- Filling out a form
- Adding a product to a shopping cart in an online store
- Subscribe to a newsletter
Time Spent on Task
The Time Spent on Task is a metric that measures the time required to complete a task.
The less time-consuming the task is, the better the user experience. Users prefer tasks that they can complete quickly and seamlessly.
There are several ways to estimate the time required to complete a task.
It can be:
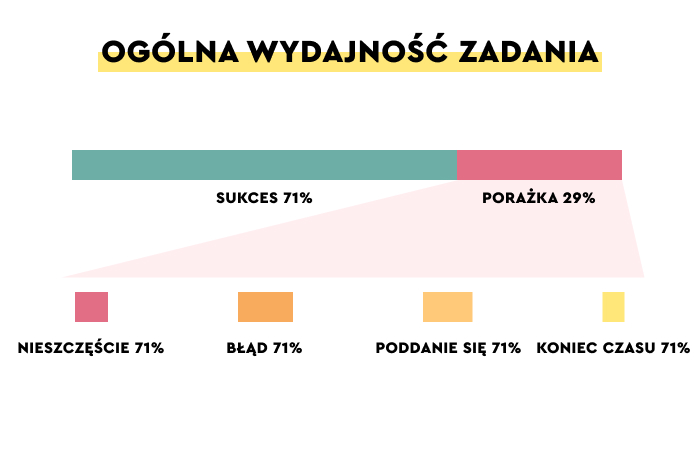
- The average time of successful completion of a task.
- The average time required for users to give up or perform a task incorrectly.
- The total average time that users spend on a task.
When we know the amount of time required to perform a given action correctly, we have insight into the possible reactions that will occur during that time.
The Time Spent on Task metric measures performance and is used to gain knowledge about the ease of interaction with a digital product.
Measuring the time required to complete a task makes it possible to:
- Diagnose usability problems
- Define the difference between the customer's latency time and the system's latency time
- Define more detailed metrics (e.g., an average time of successful completion or an average time of failure).
User Errors
The User Error indicator allows us to count the number of errors occurring while using a given product's function.
It determines how often a user makes an error while performing a task.
User Errors is a UX metric that determines how easy a feature is to use and how well it performs according to expectations and experiences.
It also helps determine how much users are confused and lost.
Measuring and monitoring the number of errors using the User Errors metric also helps us see and understand user problems and optimize the design based on the data.
A Guide to UX Metrics. Summary
- A UX metric is an indicator that allows us to determine the user experience of a digital product in an unbiased and objective way.
- Real user monitoring metrics are techniques that allow us to track user activity in real-time.
- UX metrics are most often expressed in the form of quantitative percentage data.
- They allow us to determine, measure, and compare a website or mobile application user's attitude, reaction, and behavior.
- Moreover, UX metrics help measure user engagement, satisfaction, loyalty, and usability of digital products or services.
- These indicators are used to measure, compare, and aggregate results and track trends.
- Regular, cyclical data collection with UX metrics allows us to accumulate knowledge and discover recurring reactions and behavior patterns. They also help us make predictions.
- UX indicators/metrics help us evaluate, analyze, and deduce a digital product's usability and friendliness in an unbiased and objective way.
- Most often, UX metrics are divided into quantitative metrics and qualitative metrics.
- UX metrics help to improve digital products (UX Design), optimize them, and make them more adequate to the needs.
- In addition, UX metrics allow us to recognize categories, differences, changes, and distances and determine ranges, sizes, and intensities.
- UX metrics measure user experience. Key Performance Indicators measure the condition of an organization as such.
- UX metrics (UX indicators) are used to discover the level of attractiveness, while KPIs relate more to the level of competitiveness and performance.
- The Customer Effort Score is a survey that measures the level of effort required when a user interacts with an application or website's interface.
- The Customer Satisfaction Score measures the level of satisfaction with using a digital product, expressed as a percentage or arithmetic average.
- The Net Promoter Score allows us to determine and estimate the level of satisfaction by indicating how likely a user is to recommend a product to a third party.
- The Single Ease Question is a survey that allows us to assess the difficulty level of performing a given task.
- SUPR-Q was created to assess usability, credibility, and user loyalty.
- SUS is primarily used to measure the usability of digital products and is most often utilized during usability testing.
- The Task Performance Indicator tests crucial tasks users can perform on websites or mobile apps.
- The Task Success Rate is an indicator that provides a percentage of the number of tasks a user has completed correctly.
- The Time Spent on Task is a metric that measures the time required to complete a task.
- The User Error indicator allows us to count the number of errors occurring while using a given function.