Mouse tracking/cursor tracking and mouse heatmaps (or heat maps) are research methods used in the usability testing of web applications.
Cursor tracking allows us to discover behavior, reaction, and interaction patterns in how web app users interact with its interface.
Thanks to it, we can better understand what problems users are facing.
It's not just about functionality problems but also content, page layout, navigation, and interface.
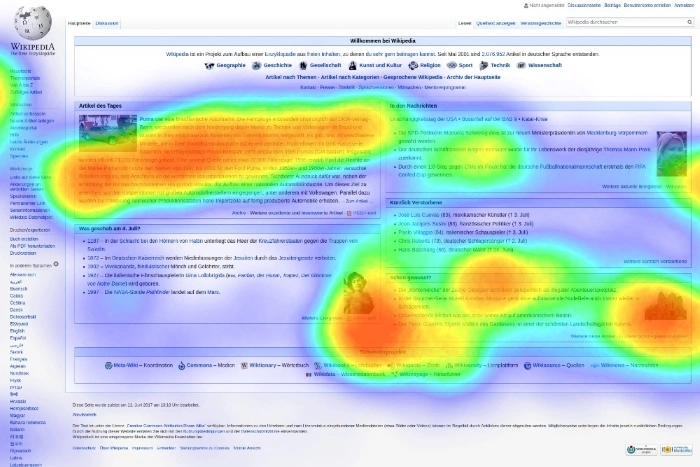
A mouse heatmap (or heat map) is a type of thermal map (used, for example, in eye-tracking research) that graphically visualizes the intensity of actions performed (like scrolling or pausing).
Thanks to the dynamic development of research tools, UX researchers are increasingly interested in this method and are incorporating it into their standard usability research corpus.
Mouse heatmaps and cursor tracking help discover attention patterns and usability problems. They're methods that form the basis for optimization activities to improve the conversion rate.
How exactly do the mouse heatmap and cursor tracking work? What are their advantages? What is the difference between mouse tracking and eye tracking?
How can mouse heatmaps and cursor tracking be helpful to UX/UI designers? What are their limitations?
If you're curious about the answers to the above questions, we cordially invite you to read our article.
What is mouse tracking?
Mouse tracking is a UX research method that uses special software that allows us to track, aggregate, and compare data representing user behavior on a site (e.g., exploring a specific area).
This method's basic premise is to draw attention to the relationship between website usability and mouse usage patterns.
![]()
How we use a mouse indicates how helpful or problematic a website is in terms of usability.
Examining elements using this method allows us to make changes (for example, to the main menu) and create a website with high usability.
Mouse tracking allows for the visual representation of website users' behavioral patterns and the identification of the elements of a website that attract the most attention and those that are indifferent or less popular (such as additional buttons).
This method is also used to discover conversion blockers and interface elements with which interaction is problematic in the following dimensions:
- Cognitive
- Manual (such as drop-down menus)
- Function
- Logical (such as making a purchase)
- Compliance with current design patterns
Mouse tracking is often a beneficial supplement to eye-tracking studies. However, eye-tracking research has limitations.
First of all, it requires specialized equipment, is expensive, and raises questions about the naturalness of a site's browsing environment.
Studies involving mouse tracking are much less expensive, don't require specialized equipment, and are conducted under much more natural conditions (from the point of view of a website user being studied).
Cursor tracking can help diagnose where the user's attention is focused, especially since the cursor is often used to read and scan a page's content.
Mouse tracking is an essential supplement to studies that measure the number of clicks. Clicks are the primary or definitive point of attention for visitors but not the only one.
User behavior on a website also includes indirect actions that can affect individual clicks or cause refraining from performing an action.
In the article "What can a mouse cursor tell us more? Correlation of eye/mouse movements on web browsing," study results were presented. According to them, when both testing methods are conducted simultaneously, there is an 84% - 88% correlation in outcomes.
According to the article's authors, there is a strong relationship between the position of the gaze and the cursor position.
In addition, there are regular patterns of eye and mouse movements.
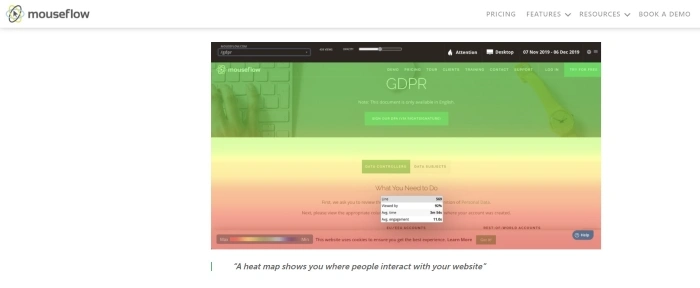
A heatmap/mouse tracking can provide additional and handy information about how users interact with websites.
Mouse movements allow us to see points of interest that don't result in clicks and help reconstruct a website user's perceptual and decision-making process.
They allow us to understand users' intentions and goals and how they achieve them (e.g., improving visibility).
In web analytics, heatmaps also have a high diagnostic value in terms of clarity, fluidity of actions, orientation, and user confusion in the structure and layout of a given page.
Combined with another research technique, the think-aloud method, it's possible to gain a better, more accurate understanding of user reactions and potential customers' problems.
Mouse heatmap. Heatmaps in UX
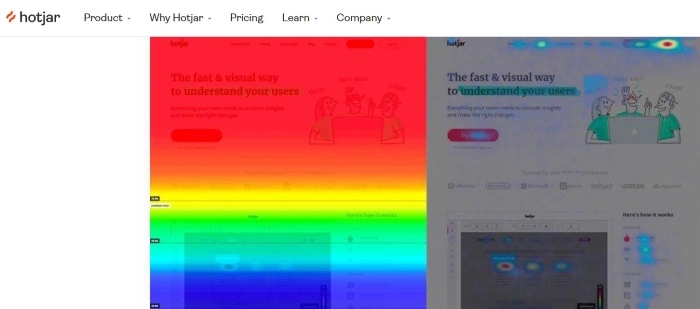
Mouse heatmaps are visual representations of a website user's interactions with its interface.
They're used to increase the conversion of individual elements (e.g., justify their relocation).
Mouse heatmaps often function under the following names: mouse-tracking heatmap, mouse movement heatmap, mouse hover map, attention map, attention heatmap, or movement map.
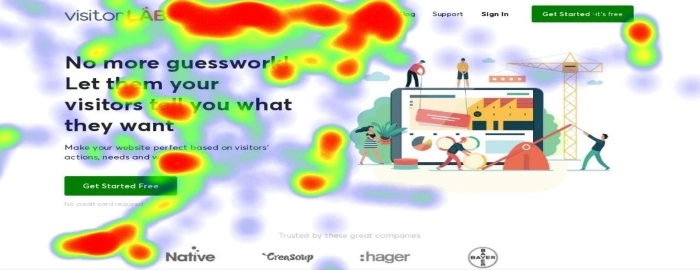
According to the standard color convention, the intensity of the red indicates multiple user actions, and the blue indicates the absence of any action. The other colors represent the spectrum of this scale.
Mouse heatmaps also show areas on a website and sections of a site that are of no interest and that users don't interact with, which is helpful in user experience design.
By analyzing the colors on a heatmap, we can discover the following:
- Frustration points on a site
- Points of distraction
- Reading patterns
- Behavioral patterns (e.g., click or scroll sequences)
- The intensity of engagement in interaction
- The extent of exploration of a website (in particular, this is important for extensive pages that require long scrolling)
- Actual behaviors that provide data that can support design and optimization decisions
- Problems in interacting with functionalities on a website (e.g., forms)
- Processes (e.g., defining mouse flows)
Simultaneously, mouse heatmaps allow us to:
- Diagnose the usability of websites.
- Determine the optimal position for given functionalities, content, and user interface elements.
- Evaluate the navigation performance—it helps us see if users navigate a website smoothly, search for links, or have difficulty navigating a site.
- Improve comfort and user experience regarding security, credibility, and trust.
- Create alerts and prompts in the most optimal places.
- Diagnose reading patterns (F-shaped pattern of reading) and determine the layout pattern (Z-pattern layout).
What is the difference between mouse tracking and eye tracking?
In principle, both types of research involve tracking. Mouse tracking involves following and graphically representing the mouse and cursor movements.
Eye tracking involves monitoring and graphically mapping the movement of the eyeballs.
Both methods aim to diagnose the elements that attract users' attention, arouse their interest, and provoke interaction.
They represent information in a positive sense (occurrence of interaction) and a negative sense (absence of interaction).
The two methods are significantly different in a technical, methodological, and cognitive sense and should be treated as complementary rather than competing methods.
The most important differences between mouse tracking and eye tracking come down to the following issues:
- Budget (eye tracking is a much more expensive method)
- Technical (mouse tracking is much simpler in terms of technology and doesn't require specialized equipment)
- Organizational (eye tracking is a method much more challenging in terms of recruitment and conducting a survey)
- Credibility (mouse tracking is much more natural and similar to actual user behavior; in addition, due to its lower cost, we can increase the sample size)
- The influence, the so-called observer effect, the Hawthorne effect (eye tracking is a method in which this effect is much stronger)
While both methods are not without limitations and flaws, we shouldn't favor one over the other.
We should study a website from multiple angles and through diverse methods (e.g., a scroll map). Only then can individual elements be optimized (for example, to improve navigation).
Eye tracking, through the use of specialized equipment, makes it possible to capture involuntary behavior resulting from specific automatic reactions and actions taking place outside of the user's full awareness but affecting the course of their interaction with a website.
We should also remember that eye tracking includes following the peripheral vision, which isn't insignificant.
Mouse tracking, on the other hand, allows us to get better insight into users' intentions on our website and discover and understand voluntary actions.
These two methods also differ significantly in terms of competence, experience, and knowledge necessary to interpret the research results correctly.
Eye tracking is a much more specialized method that requires this knowledge. We need to know what we're doing when tracking eye movements.
Mouse tracking doesn't cause such problems and is much more cognitively accessible to those without specialized equipment and experience conducting, analyzing, and interpreting user experience research results.
Types of heatmaps
- Click maps
- Scroll maps
- Mouse-tracking heatmaps
- Eye-tracking heatmaps
- Error click heatmaps
- Rage click heatmaps
- Dead click heatmaps
- AI-generated heatmaps
Click maps
Click maps are one of the most traditional types of website heatmaps. They help us see where users click on our sites and identify clickable elements that convert the most or least. Additionally, click maps can reveal potential problems with navigation; they show us elements with which users try to interact and whether they were successful or not.
We can improve CTA buttons and conversion rate and eliminate bounce rate and user friction thanks to click maps.
Scroll maps
Scroll maps show users' scrolling behavior, allowing us to see how far down a site users scroll.
They help us gather data regarding the following:
- The number of users who scrolled a page from top to bottom
- The number of users who scrolled through a page but stopped for some reason
- The number of users who left a page
- The percentage of users who scrolled a page and to what degree (e.g., 30% of users scrolled a page from top to bottom)
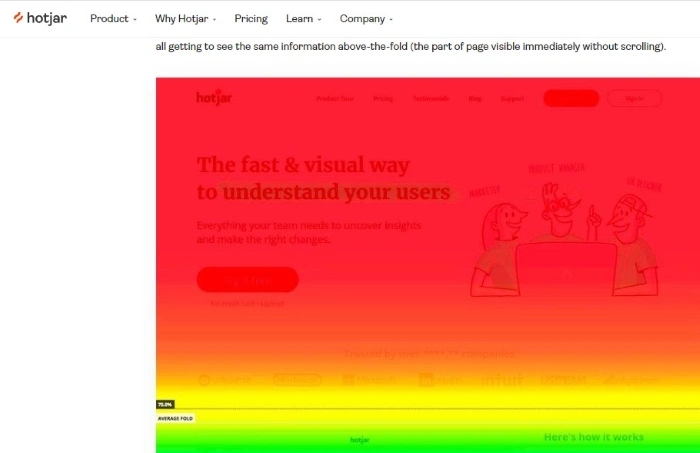
Scroll maps help determine where to put content and identify the fold line. This allows us to ensure that crucial information or CTA buttons aren't below the fold where users won't see them, or at least not as often.
Moreover, scroll maps can also show us if our pages have false floors (false bottoms). This means that sometimes users think they have reached the end of a site, but in reality, they haven't.
It's important to note that if we decide to use a scroll map to analyze our web pages, we should consider data from both desktop and mobile devices. That's because the fold line on these devices will differ.
Mouse-tracking heatmaps
Mouse-tracking heatmaps (also called mouse movement heatmaps) follow a broader movement range than click maps. They track general mouse movements instead of just clicks. Thus, we can see where users move their mouse precisely and identify hover patterns.
Numerous studies show a correlation between where users are looking and where their mouse cursor is, and that's why mouse-tracking data is so helpful.
Mouse-tracking heatmaps allow us to discover areas where user frustration occurs and improve conversion by determining the most "popular" places on our site or whether users filled out forms or hovered over CTA buttons.
Eye-tracking heatmaps
Eye-tracking heatmaps utilize sensors to track the users' eye movements when they're on a web page. The eye-tracking technology keeps track of eye movement, blinking, and pupil dilation, allowing us to see where users' attention is focused. This type of heatmap is often used alongside mouse-tracking heatmaps.
This type of heatmap can help us design more user-friendly website layouts and create elements that attract users' attention.
Error click heatmaps
Error click heatmaps enable us to determine elements that cause errors when users interact with them. These might be JavaScript, HTML, or CSS errors or connection exceptions such as failure to connect to a server.
We can discover any possible issues or bugs thanks to tracking error clicks and fix them as quickly as possible.
Rage click heatmaps
Rage clicks occur when users encounter elements they think are clickable but aren't or when a CTA button or other interactive element doesn't operate as it should (resulting in an error or being unresponsive).
Rage click heatmaps show us areas where users become frustrated, allowing us to eliminate or improve them.
Dead click heatmaps
Dead clicks occur when users mistake static elements for clickable buttons. Users click on something and expect a response that doesn't happen.
This type of website heatmap enables us to identify elements that confuse and mislead users, allowing us to redesign them. Additionally, it helps us observe user behavior and discover potential areas for placing buttons or other interactive elements.
AI-generated heatmaps
AI-generated heatmaps predict user interactions and behavior instead of analyzing them by utilizing machine learning algorithms. Artificial intelligence foresees future user behavior by emulating it. It discovers places to which users pay the most attention (or the least).
With AI-generated heatmaps, we can place elements in users' places of interest even before they start to interact with a website. It's said that these types of heatmaps are highly accurate and less expensive than eye-tracking.
Why should we use mouse tracking and mouse heatmaps?
Perhaps the most obvious benefit of using this research method is the ability to make a website much more:
- Useful
- Friendly
- Easy to use
- Understandable
In addition, heatmap analysis gives insight into the natural behavior within the site structure and provides a visual context that we can easily share with stakeholders.
The high credibility of the research and its results makes it possible to assess to what extent a website raises problems in terms of:
- Function
- Information
- Navigation
Some of the most essential elements that we can optimize with mouse-tracking results include the following:
- Interactive functionalities
- Links
- Menus (especially the drop-down menus)
- Scrollbars
- Text blocks
- Forms (e.g., credit card forms)
- Pagination
- Page template
Mouse tracking also allows us to discover the following:
- Attractors and distractors — elements that attract attention and cause distraction
- Error-generating elements
- Previously unknown use cases
- Elements that support user flow on websites
- Elements that favor or hinder reading and scanning the content of a page
- Elements that improve as well as decrease conversion rate results within a site
UX research based on tracking also helps:
- Speed up design and business decision-making processes.
- Justify decision-making with data.
- Make decisions based on representations of actual behavior rather than perceptions of it.
- Discover the navigation process.
- Make interface changes that reduce interaction costs.
- Discover patterns of repetitive behavior, choices, and usage scenarios.
- Deduce the reasons for the effectiveness or failure of crucial conversion elements (e.g., call to action).
- Discover and resolve the issue of rotten/broken links.
Mouse-tracking tools for tracking user behavior
Here are some examples of mouse-tracking tools that can help with creating heatmaps:
- Mousetrap
- OGAMA
- MouseTracks
- Hotjar
- Fullstory
- Smartlook
- Dragonfly AI
- Mouseflow
Mouse tracking and mouse heatmaps. Summary
- Mouse cursor tracking and mouse heatmaps are increasingly popular research methods, especially in usability testing of web applications (UX testing).
- Its purpose is to record the actual behavior of website users.
- Mouse tracking/a heatmap analysis is a method that helps to understand users' problems much better (than, for example, a click map).
- Cursor tracking helps discover attention patterns and usability problems.
- This method often forms the basis for optimization activities that significantly increase conversion (conversion rate).
- Cursor tracking is a research method for aggregating and comparing information about user behavior.
- The basic premise of this research method is that how we use the mouse indicates how useful or problematic a website is in terms of usability.
- Mouse tracking allows us to create a visual representation of the behavioral patterns of website users.
- Mouse movements help reconstruct the perceptual and decision-making process of a website user.
- Mouse heatmaps are visual representations of a website user's interactions with its interface.
- They also show the parts of a website that are of no interest.
- Mouse-tracking and eye-tracking studies are complementary, not competitive, methods.
- Both methods aim to discover the elements that attract users' attention, arouse their interest, and provoke interaction.
- Eye tracking allows us to capture involuntary behavior resulting from automatic actions taking place outside the user's full awareness.
- It's helpful to use heatmaps to understand better the intent of users who arrive on a site and their actions.
- Tracking-based research (e.g., tracking page scrolling, tracking mouse cursor movements) helps justify the decision-making process (regarding business and design).
- In web analytics, heatmaps are used very often.
- In addition, mouse heatmaps help make decisions based on representations of natural behavior and discover the navigation process.